
Explainer
"Affordable" rent or social rent: what's the difference?

When a developer or a council talks about “affordable” homes, it doesn’t necessarily mean homes you could afford. In planning, “affordable housing” is a category with its own rules. It includes homes to buy at a discount and shared ownership, and two kinds of home to rent: Social Rent and Affordable Rent. Those two rents can be very different.
The two rents
Social Rent is set by a government formula. For each home, the weekly rent is:
- 70% of a national average rent (£54.62, from April 2000), multiplied by how earnings in the county compared with England’s in 1999, and by a weight for the number of bedrooms (from 0.8 for a bedsit up to 1.4 for six bedrooms or more);
- plus 30% of that national rent, multiplied by how the home’s value compared with England’s average of £49,750, in January 1999;
- then raised each year by amounts the Government sets: since April 2026, by inflation (CPI) plus 1 percentage point.
So it’s tied mainly to what people earn, not to what the market will charge. In Essex, earnings in 1999 were about 3% above England’s.1 Landlords can set it up to 5% above the formula, and there’s a cap for each size of home: in 2026-27, Social Rent for a three-bedroom home can’t be more than £228.36 a week.
Affordable Rent can be set at up to 80% of the market rent, including any service charges. So it’s tied to what the market will charge. Where private rents are high, it can be high too.
Neither name tells you anything about the quality of the home, or about the people living in it.
What that could mean in Uttlesford
Council homes here are let at or below Social Rent. This table compares what Uttlesford District Council (UDC) budgets as its average rent with the most an Affordable Rent could be, based on average private rents in the district.2
| Bedrooms | Average UDC council rent, a week | Average private rent, a week | 80% of that, a week |
|---|---|---|---|
| 1 | £113 | £211 | £169 |
| 2 | £134 | £267 | £213 |
| 3 | £146 | £337 | £270 |
| 43 | £165 | £475 | £380 |
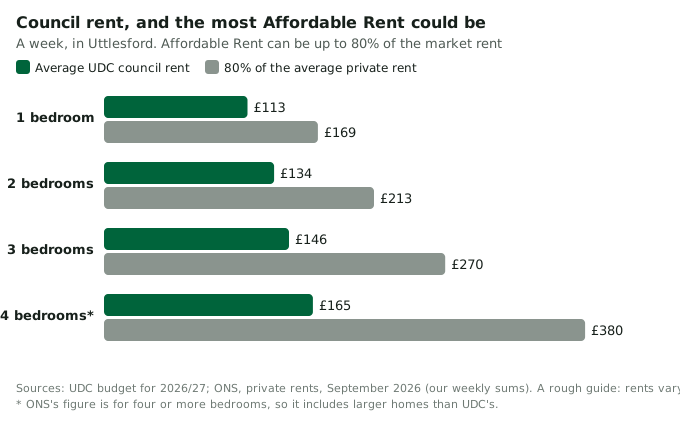
For a three-bedroom home, that’s a difference of up to ~£124 a week (£270 against £146), or ~£6,400 a year.
It’s only a rough guide, for two reasons. A landlord sets Affordable Rent against the market rent for that particular home, which may be below the district’s average, and it can choose to charge less than 80%. And most of UDC’s rents are below the formula, so a new home at Social Rent would probably cost more than these averages.
Where it matters here
Alexia House, Great Dunmow. UDC plans nine family homes on the site. Its report to Cabinet says the scheme would pay its way without grant if the homes were let at Affordable Rent, capped at the Local Housing Allowance (the limit on housing benefit for private renters). But UDC plans to apply for a Government grant so that they can be let at Social Rent, “which is significantly more affordable for our customers”.
Stansted and Birchanger. City & Country offers 50% “affordable” homes across its two schemes, now at a public inquiry. A statement signed by the firm and the council on 28 October lists 134 of those 240 homes at “Affordable/Social Rent”, without saying how many would be which. The draft terms in June’s committee report said “Affordable Rent”. When I last checked, the final legal agreement hadn’t been published. National policy counts both rents as affordable housing, but as the table shows, it makes a difference which one people get.
Across England. The Government’s main funding programme for new affordable homes expects at least 60% of the homes it funds to be for Social Rent.
Where Greens stand
Greens want many more homes at Social Rent. Our national manifesto pledges 150,000 new social homes every year, through new building and through buying and refurbishing older homes.
Next time you see “affordable” on a planning notice or a developer’s leaflet, it’s worth asking what they mean by that.
Sources
Ministry of Housing, Communities and Local Government
- National Planning Policy Framework: Annex B, glossary — guidance, updated 29 September 2026.
- Policy statement on rents for social housing — policy paper, 1 April 2026.
- Social and Affordable Homes Programme (SAHP) 2026 to 2036 — guidance.
Office for National Statistics
- Housing prices in Uttlesford — statistics, private rents to September 2026, updated 21 October 2026.
Planning Inspectorate inquiry documents
- Stansted Call-in Inquiry Core Documents — shared folder linked from City & Country’s page, including the statement of common ground on affordable housing (CD6.5), 28 October 2026.
Uttlesford District Council
- Budget for 2026/27 — budget report, February 2026.
- Reports pack — Planning Committee, 10 June 2026.
- Uttlesford Housing Futures: Options for Alexia House — report to Cabinet, 15 October 2026.
- 30 Year Housing Revenue Account Business Plan — appendix to a report to Cabinet.
Green Party
- Providing fairer, greener homes for all — manifesto page.
Footnotes
-
Our arithmetic from the formula’s own figures: average manual earnings of £325.90 a week in Essex, against £316.40 for England, both for 1999. The figure is for the old county of Essex, which included Southend and Thurrock. ↩
-
Our arithmetic. ONS gives average monthly private rents for September 2026, which we’ve multiplied by 12 and divided by 52, then taken 80% of. UDC’s figures are its 2026/27 budgeted averages. Service charges are separate from social rents, but included in the 80%. ↩
-
ONS’s figure is for homes with four or more bedrooms, so it includes larger homes than UDC’s four-bedroom figure. The gap in this row is less reliable than the others. ↩